CHART: Balance on Current Account, '94-'00 |
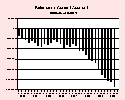
Balance on Current Account
In the third quarter of 2000, the U.S. current-account deficit on international transactions increased
to $113.8 billion. |
Previous
-$105.0
2nd Quarter 2000
(billions of dollars)
|
Current
-$113.8
3rd Quarter 2000
(billions of dollars)
|
Provided by
Bureau of Economic Analysis
as of December 14, 2000.
|

CHART: Monthly trade balance |
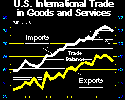
U.S. International Trade in Goods and Services
The Nation's international deficit in goods and services decreased to $33.2 billion in October, from $33.7 billion (revised) in September, as imports decreased more than exports. |
Previous
-33.7
September 2000
$ billion
|
Current
-33.2
October 2000
$ billion
|
Provided by
U.S. Census Bureau
as of December 19, 2000.
|

CHART: International R&D/GDP Ratios |
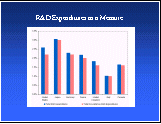
R&D Expenditures as a percent of GDP
The U.S. ratio of R&D to Gross Domestic Product is expected to increase to 2.65% in 1999, but will remain at a level less than Japan (3.06% in 1998) and more than Germany (2.29% in 1998). |
Previous
2.59%
1998
|
Current
2.65%
1999 (preliminary)
|
Provided by
National Science Foundation, SRS
as of December 2000.
|

CHART: Monthly Crude Oil and Petroleum Product Imports |
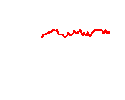
Net Oil Imports
Includes crude oil and petroleum products net of exports.
|
Previous
9.28
September, 2000
Million Barrels per Day
|
Current
8.87
October, 2000
Million Barrels per Day
|
Provided by
Energy Information Administration
/
Monthly Energy Review
as of January 9, 2001.
|

