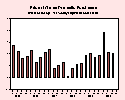
CHART: Gross Domestic Purchases Prices, '95 - '00 |
Gross Domestic Purchases Prices
In the third quarter of 2000, the prices paid by U.S. purchasers for final goods and services increased 2.0 percent at a seasonally adjusted annual rate. |
Previous
+2.1
2nd Qtr 2000
(% change)
|
Current
+2.0
3rd Qtr 2000
(% change)
|
Provided by
Bureau of Economic Analysis
as of December 21, 2000.
|

CHART: Consumer Price Index |
Consumer Price Index
All items, U.S. City Average, All Urban Consumers, seasonally adjusted, 1982-84=100. 1-month percent change. |
Previous
0.2
October 2000
|
Current
0.2
November 2000
|
Provided by
Bureau of Labor Statistics
as of December 15, 2000.
|

CHART: Producer Price Index |
Producer Price Index
Finished Goods, seasonally adjusted, 1982=100. 1-month percent change. |
Previous
0.4
October 2000
|
Current
0.1
November 2000
|
Provided by
Bureau of Labor Statistics
as of December 14, 2000.
|

CHART: Prices Received Index |
Prices Received by Farmers
The All Farm Products Index of Prices Received was unchanged from November but 7 points
above December 1999. |
Previous
98
November 2000
Index (1990-92=100)
|
Current
98
December 2000
Index (1990-92=100)
|
Provided by
National Agricultural Statistics Service, USDA
as of December 29, 2000.
|

CHART: Prices Paid Index |
Prices Paid by Farmers
The Prices Paid by Farmers Index was unchanged from November but 4 points above December
1999. |
Previous
121
November 2000
Index (1990-92=100)
|
Current
121
December 2000
Index (1990-92=100)
|
Provided by
National Agricultural Statistics Service, USDA
as of December 29, 2000.
|

CHART: Retail Gasoline Prices |
Crude Oil Prices
Spot West Texas Intermediate (WTI) - Cushing.
|
Previous
$27.16
January 5, 2001
$'s/Bbl.
|
Current
$28.81
January 12, 2001
$'s/Bbl.
|
Provided by
Energy Information Administration
/
Weekly Petroleum Status Report
as of January 16, 2001.
|

